Performance Profiling in Python: Tools, Techniques, and an Unexpected Culprit
Recently, my team encountered a performance issue with our Python service that uses FastAPI, gunicorn, uvicorn, and the OpenAI API. The service works fine in development, but when we load-tested it in our staging environment, the response time skyrocketed, and the throughput became embarrassingly low. Luckily, it was us stressing the service.
In this post, I'll walk through how we diagnosed and fixed this performance bottleneck. While the specific issue we found might not match your next performance problem, the debugging process and tools we used should be helpful for any Python developer dealing with similar challenges.
I've created a minimal reproducible example that demonstrates the exact same issue we encountered. Let's dive in.
Recognizing the Symptoms
We noticed that as we scaled up concurrent users, response times became significantly worse. We load-tested the service to understand its behaviour under pressure. Using Apache Benchmark (ab), a handy tool for simulating user load, we were able to quantify the problem.
We can run it as follows to simulate a single user hitting the service:
ab -l -c 1 -n 10 http://localhost:9000/
The median response time in this case is 1545 milliseconds, and the throughput is 0.58 requests per second (RPS).
Based on this, in an ideal world, 75 concurrent users should receive the same response time, and the throughput should increase 75-fold to about 43 RPS. Let's try:
ab -l -c 75 -n 200 http://localhost:9000/
Results:
- Median response time: 35306ms
- RPS: 1.95
Huston, we have a problem! But where to begin?
Suspects
The application relies on AsyncIO, so our initial hunch was that there might be a blocking call somewhere causing multiple requests to wait for each other. We enabled the debug mode for AsyncIO but couldn't find coroutines with unexpectedly long execution times. That wasn't the issue.
Next was the DB. We use OpenTelemetry to collect traces from our apps, including traces for DB queries. A quick look at our traces showed that the DB queries were very efficient, taking only a few milliseconds each, and there were only a few of them per request. Even if DB queries blocked the event loop, they couldn't cause the performance issue we were observing.
Lastly, we checked the CPU utilisation while load-testing the service. It was clearly at 100%. We were on to something!
Investigating Inefficient Code
The code is inefficient? Here comes the profiler! It allowed us to examine the time spent in each function, the number of times each function is called, and the relationships between function calls.
While Python's built-in cProfile is a common choice, we opted for Yappi instead. Why? Because our service heavily relies on asynchronous code (coroutines), and Yappi handles them better than cProfile. A rule of thumb: if you use AsyncIO, just use Yappi. We tried cProfile, and it didn't help us much in this case.
Setting up Yappi
Integrating Yappi into our FastAPI application was straightforward:
import contextlib
import pstats
import yappi
from fastapi import FastAPI

@contextlib.asynccontextmanager
async def lifespan(app=FastAPI):
    yappi.start()
    try:
        yield
    finally:
        stats = yappi.get_func_stats()
        ps = yappi.convert2pstats(stats.get())
        # TIME is total time spent within function excluding callees
        ps = ps.sort_stats(pstats.SortKey.TIME)
        ps.dump_stats("profile.stats")  # Dump profiling info to profile.stats
        ps.print_stats(20)  # Printing the top 20 calls

app = FastAPI(lifespan=lifespan)
With this setup, whenever the service stopped, Yappi would dump the profiling data, sorted by total time in descending order. We initially tried cumulative time but this resulted in a report of the top-level functions (like the endpoint handler), not the most inefficient ones.
It is time to gather some evidence!
Profiling under Load
We ran the same load test again, with Yappi enabled:
ab -l -c 75 -n 200 http://localhost:9000/
At the top of the profiling data, we found this:
   ncalls  tottime  percall  cumtime  percall filename:lineno(function)
    43450   16.802    0.000   73.513    0.002 /home/tgurion/.local/share/uv/python/cpython-3.12.6-linux-x86_64-gnu/lib/python3.12/email/feedparser.py:216(FeedParser._parsegen)
  5497700   15.427    0.000   22.207    0.000 /home/tgurion/.local/share/uv/python/cpython-3.12.6-linux-x86_64-gnu/lib/python3.12/email/feedparser.py:77(BufferedSubFile.readline)
  5497700   14.446    0.000   36.653    0.000 /home/tgurion/.local/share/uv/python/cpython-3.12.6-linux-x86_64-gnu/lib/python3.12/email/feedparser.py:127(BufferedSubFile.__next__)
A significant amount of time was spent in email/feedparser.py! This was unexpected, as our service didn't directly use email parsing. Where does this call come from?
Visualising the Call Relationships
To visualise the call relationships, we used gprof2dot - a tool to convert the profiling output into a Graphviz .dot file, which is a common file format for graph diagrams. We then used xdot to view the diagram. There's also an option to use dot directly to convert the file to png. More specifically:
# Convert the profiling output to a .dot file
gprof2dot -f pstats profile.stats > profile.dot
# Convert the .dot file to png
dot -Tpng profile.dot -o profile.png
# Open the .dot file in an interactive viewer
xdot profile.dot
Here are the profiling results. It shows the call graph of the service. Each node represents a function, and the edges represent calls between functions. More on the meaning of the stats on nodes and edges can be found in the gprof2dot docs.
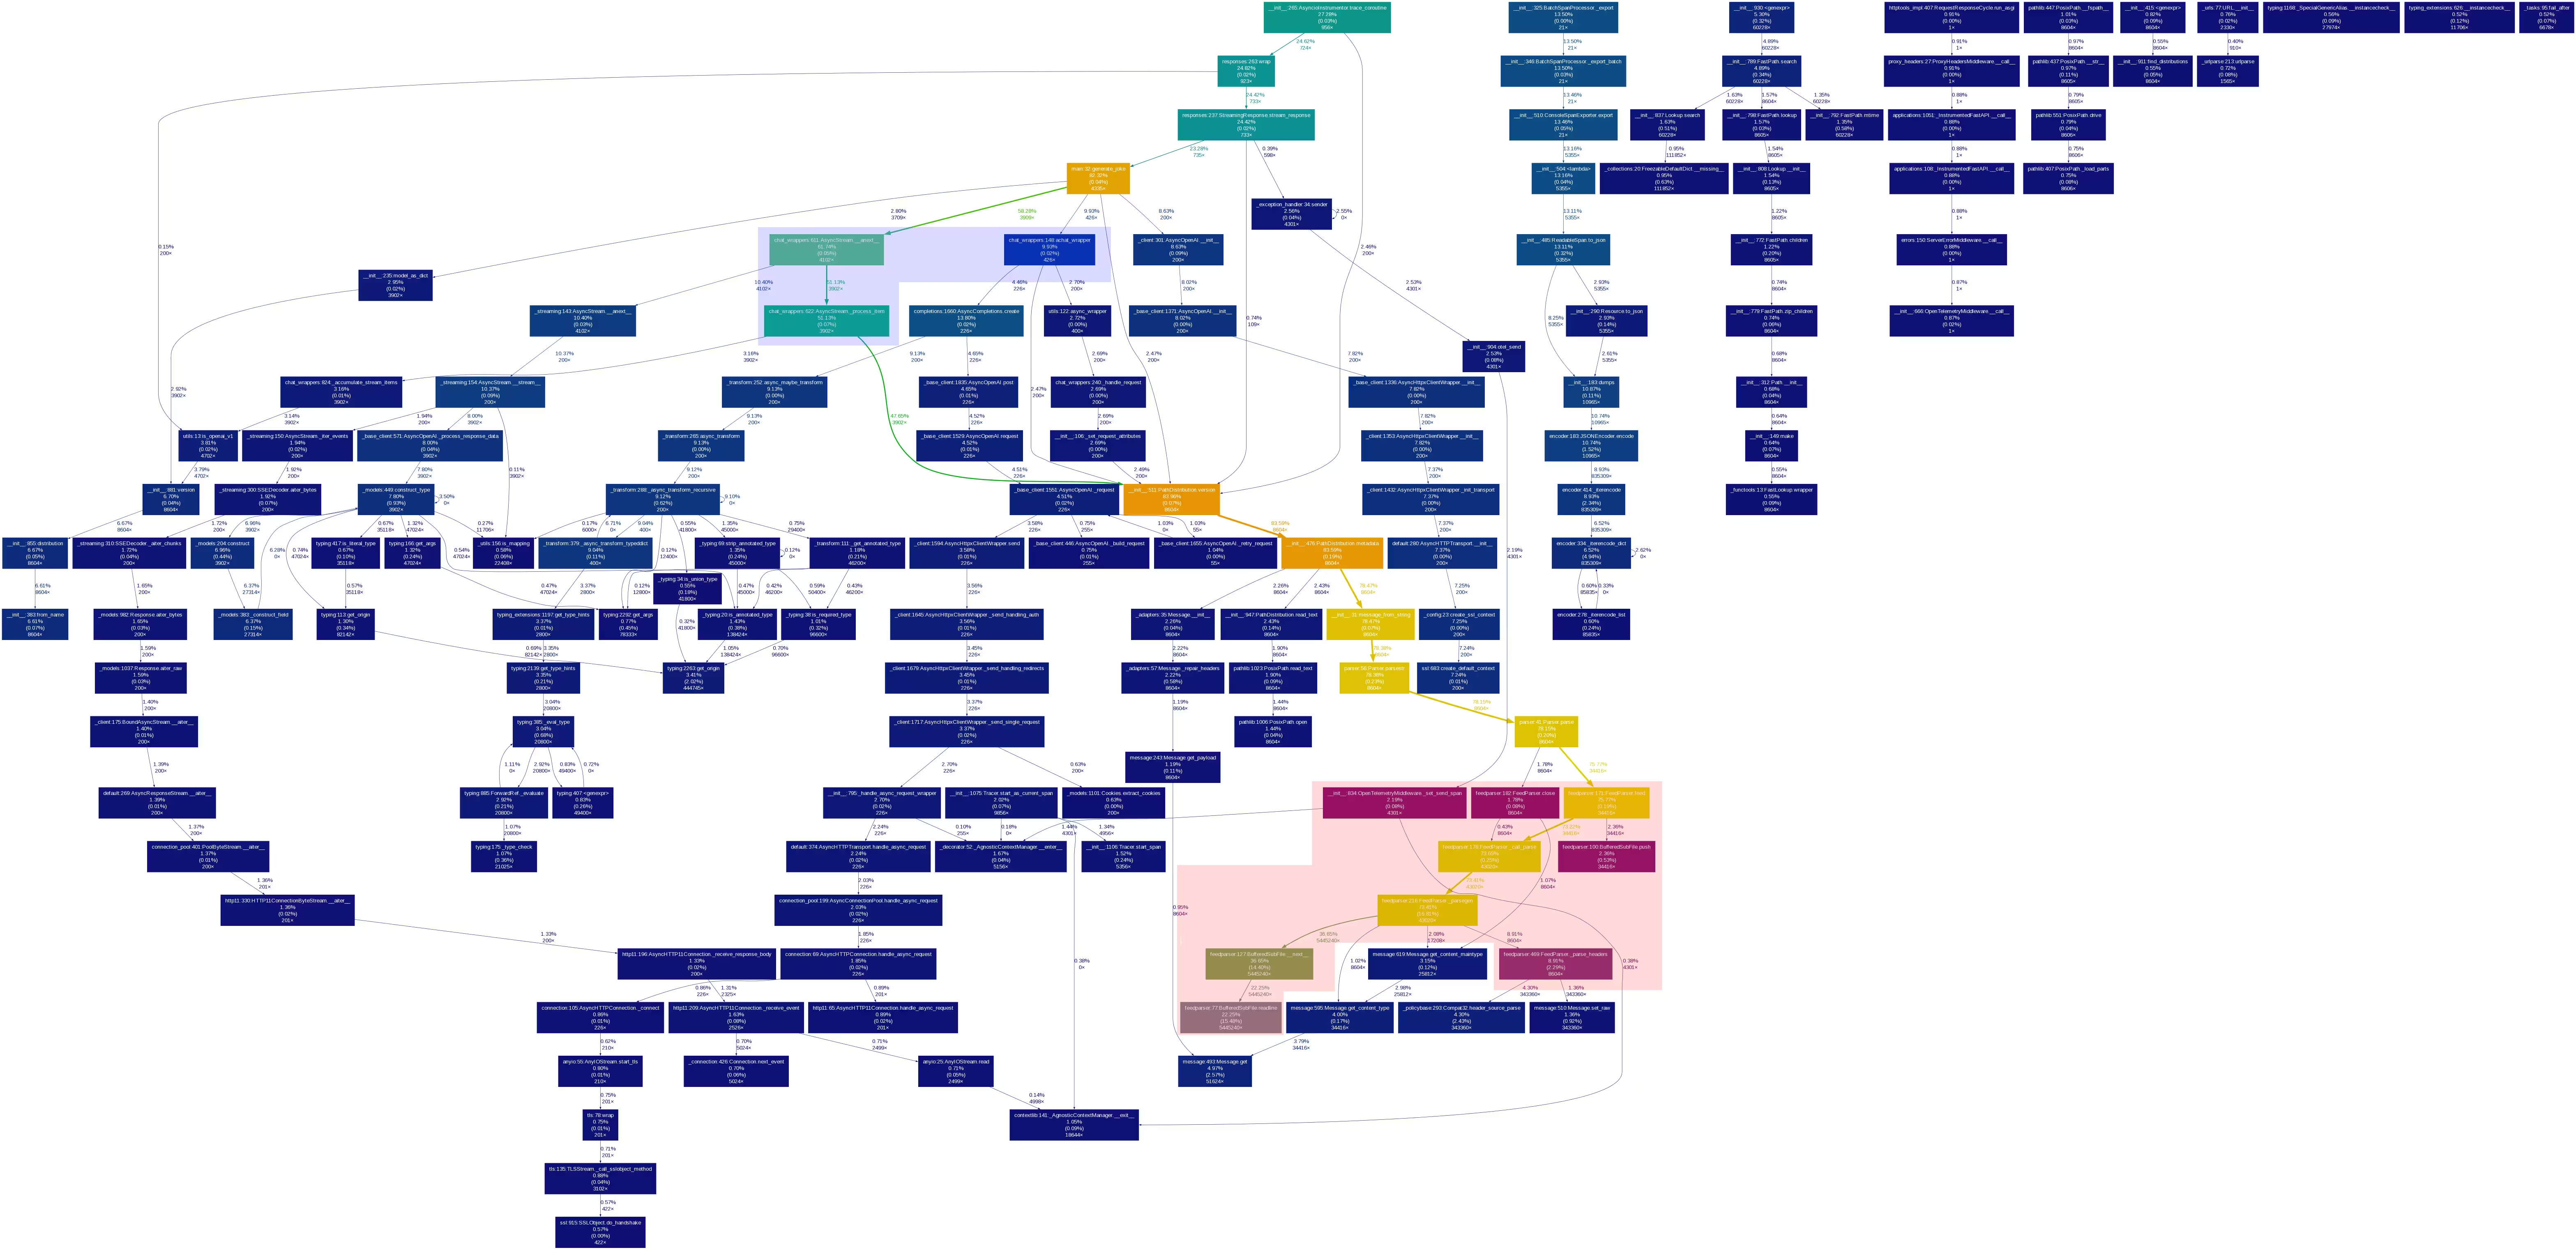
Note: I wish I could have dropped an xdot-like interactive experience here, but that's hard to do, so you've got a manually annotated image instead. You can enlarge it; it's high-res.
The feedparser.py functions are annotated in red. Almost all of the calls to it are coming from a single source, annotated in blue. This is the opentelemetry-instrumentation-openai library 😱
The Culprit: OpenTelemetry OpenAI Instrumentation
The OpenTelemetry OpenAI instrumentation helps us understand our calls to OpenAI. While convenient, it appeared to be a major performance bottleneck. But before we pronounce the defendant guilty, one last test.
We removed the opentelemetry-instrumentation-openai library and reran the load test. Here are the results before and after the change:
| Metric | Before | After |
|---|---|---|
| Median response time (ms) | 35306 | 15161 |
| Requests per second | 1.95 | 4.76 |
That's more than double the throughput with less than half the response time!
At this point, we removed the instrumentation library. But let's not finish our story on a negative note. Back to the .dot file!
The Fix
The .dot call graph suggested that importlib_meta.version might be the bottleneck. This function takes a distribution (something you might install with pip) and returns the version currently installed. It was called 8604 times, and it is responsible for the calls to feedparser.py, which accounts for almost 84% of the total execution time of the service. Checking the opentelemetry-instrumentation-openai source, I found two calls to this function. I was very happy to find that this is the bottleneck as, although computationally intensive, it is: (a) completely deterministic, and (b) called only with 2 literal values: version("openai") and version("pydantic"). Moving these to happen at import time was a simple fix.
At the time of writing, the maintainers of the library have not yet merged the PR. We are waiting for that and will then add the instrumentation library back to our service.
Sharing the Findings
I've documented this entire investigation in this GitHub repository, including the code, instructions for reproducing the issue, and the profiling results. I've also raised an issue on the OpenTelemetry instrumentation library's repository to inform the maintainers of the performance problem and submitted a PR with a fix.
Lessons Learned
This investigation taught us valuable lessons about debugging performance issues:
- Load testing is crucial. We regularly load test our staging environment, which is configured very similarly to our production environment. When we notice issues, we usually manage to replicate them quite easily in local development. In this case, the minimal reproducible repo (from which all of the examples in this post are drawn) was enough to reproduce the problem, find the culprit, and come up with a fix.
- Having the right tools is essential. AsyncIO debug mode showed us immediately that the issue was not related to blocking calls from coroutines. Traces from the DB queries confirmed it wasn't a DB issue either.
htophinted at the issue when we saw 100% CPU utilisation during load tests, as up to that point we assumed the service is IO bound, not CPU bound. Yappi immediately sent us in the right direction. Visualising the profiling output helped us quickly understand what was going on and come up with the fix. - Validate your changes. Once you've made a change, re-run your load tests to confirm that it has resolved the issue.
- Continuous learning is important. The techniques described above worked for me in this case. They might not work in a different investigation. There are certainly other ways to profile services, understand the call graph, and so on. I'm keen to learn about them! This post serves as a reminder for myself of what I've done, should I encounter similar problems in the future, and as a guide for anyone interested in learning some techniques to do the same.
- The AI stack is still evolving. On a broader level, we learned that much of the rapidly moving AI stack is not as robust and performant as one would expect. This is not the first time our team has encountered performance issues with popular libraries, raising the question of how these things even run in production. It seems that a lot of current development work focuses on delivering prototypes without much emphasis on performance. There might be another blog post dedicated to this topic coming soon 😉
This blog post was made with the help of Gemini Experimental 1206 and Claude 3.5 Sonnet.