Participants movement tracking animations from my MA experiment #2
The following animated renditions are a byproduct of the video tracking an analysis of my MA thesis second experiment.

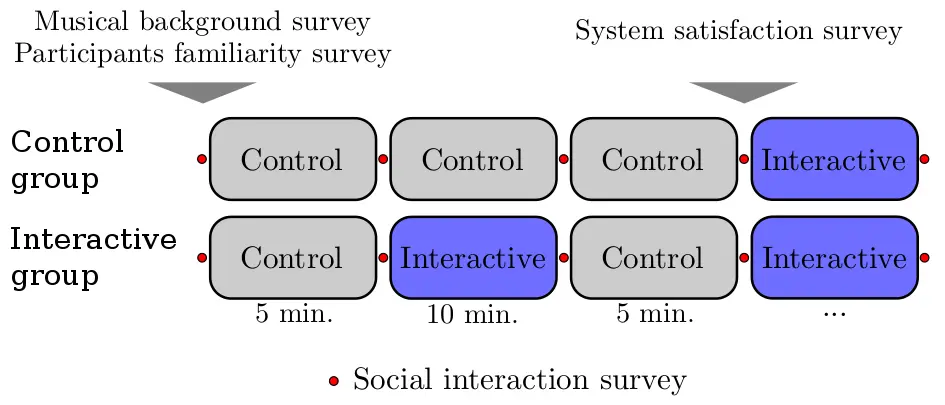
The figure above shows a schematic diagram of the experiment design. The videos are of session 1 to 3 of each of the groups (the last session wasn't analyzed). They have been for great help in gaining insights about the social interactions between the participants themselves and between the participants and the system components.
The analysis repository can be found at github. Additional information about the research can be found here.